
Technical Commentary:
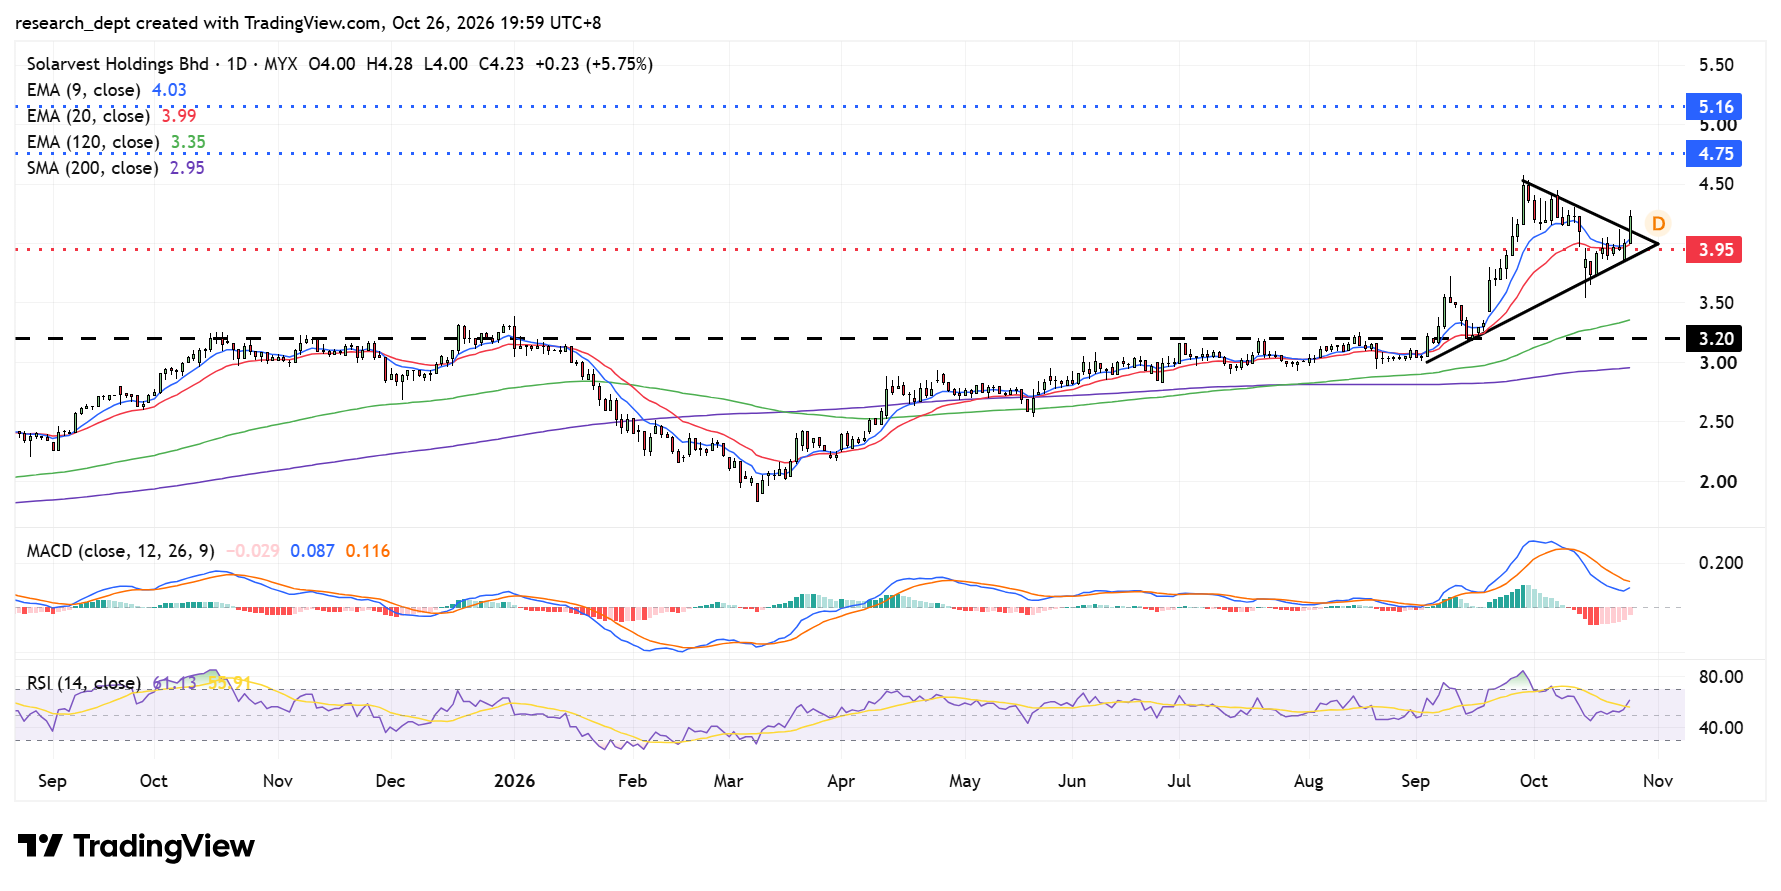
Solarvest has been trending higher since breaking out of its prolonged consolidation in September and has now broken above a Symmetrical Triangle pattern, signalling a potential continuation of its uptrend. The stock is trading above all key moving averages, while the MACD is approaching a bullish crossover and the RSI is hovering around 50, suggesting scope for further upside.
We expect further upside towards RM4.75 and RM5.16, while the stop-loss is set at RM3.95.

Disclaimer
The report is for internal and private circulation only and shall not be reproduced either in part or otherwise without the prior written consent of Apex Securities Berhad. The opinions and information contained herein are based on available data believed to be reliable. It is not to be construed as an offer, invitation or solicitation to buy or sell the securities covered by this report.
Opinions, estimates and projections in this report constitute the current judgment of the author. They do not necessarily reflect the opinion of Apex Securities Berhad and are subject to change without notice. Apex Securities Berhad has no obligation to update, modify or amend this report or to otherwise notify a reader thereof in the event that any matter stated herein, or any opinion, projection, forecast or estimate set forth herein, changes or subsequently becomes inaccurate.
Apex Securities Berhad does not warrant the accuracy of anything stated herein in any manner whatsoever and no reliance upon such statement by anyone shall give rise to any claim whatsoever against Apex Securities Berhad. Apex Securities Berhad may from time to time have an interest in the company mentioned by this report. This report may not be reproduced, copied or circulated without the prior written approval of Apex Securities Berhad.
| Stock | Last (RM) | Change (RM) | Volume |
|---|---|---|---|
| 0.065 | -0.020 | 125.14M | |
| 0.075 | 0.000 | 108.43M | |
| 0.960 | 0.030 | 66.42M | |
| 0.505 | 0.030 | 55.58M | |
| 0.050 | -0.025 | 54.35M | |
| 0.345 | 0.010 | 49.61M | |
| 0.160 | 0.005 | 47.20M | |
| 0.220 | 0.025 | 37.57M | |
| 0.135 | 0.015 | 34.34M | |
| 0.005 | 0.000 | 33.37M |
| Stock | Last (RM) | Change (RM) | Volume |
|---|---|---|---|
| 94.980 | 4.720 | 77.80K | |
| 41.240 | 0.660 | 166.90K | |
| 7.600 | 0.400 | 20.70K | |
| 8.460 | 0.260 | 58.70K | |
| 2.700 | 0.220 | 1.49M | |
| 19.540 | 0.220 | 319.50K | |
| 0.870 | 0.220 | 6.00K | |
| 28.880 | 0.220 | 1.20K | |
| 7.470 | 0.210 | 2.72M | |
| 3.160 | 0.180 | 4.78M |
| Stock | Last (RM) | Change (RM) | Volume |
|---|---|---|---|
| 12.760 | -0.480 | 871.20K | |
| 19.580 | -0.420 | 261.30K | |
| 8.760 | -0.260 | 389.90K | |
| 29.660 | -0.240 | 324.60K | |
| 16.280 | -0.220 | 24.00K | |
| 12.820 | -0.160 | 253.40K | |
| 5.200 | -0.150 | 0.30K | |
| 5.710 | -0.130 | 3.20K | |
| 19.160 | -0.120 | 37.50K | |
| 2.580 | -0.120 | 2.30K |
| Currency | Buy Rates (RM) | Sell Rates (RM) |
|---|---|---|
| USD | 4.071839 | 4.104407 |
| EUR | 4.575825 | 4.584927 |
| CNY | 0.612729 | 0.613347 |
| HKD | 0.519047 | 0.523207 |
| SGD | 3.181307 | 3.206801 |
Last Updated: Tuesday, October 27, 2026
This website, academy.apexetrade.com ("the Website"), is owned and operated by Apex Securities Berhad ("Apex" or "the Company"). By accessing or using this website, you agree to comply with and be bound by the following disclaimer:
1. Intellectual Property and Usage: All contents and materials on academy.apexetrade.com are protected by copyright, trademark, and other applicable intellectual property and proprietary laws. Users may download materials for personal use only, and any other use requires explicit written permission from Apex. Modification, reproduction, distribution, or exploitation of these materials is strictly prohibited.
2. Forward-Looking Statements: This website may contain forward-looking statements regarding Apex's future plans, targets, and objectives. These statements are subject to uncertainties, and actual results may differ materially. Users are advised not to place undue reliance on these statements, and Apex disclaims any obligation to update or alter them.
3. Investment Information Disclaimer: The information on this website does not consider specific investment objectives, financial situations, or individual needs. It is published for informational purposes and general circulation only. Users should exercise judgment, seek independent professional advice, and carefully evaluate transactions or product purchases mentioned on this website based on their own objectives and circumstances.
4. General Disclaimer: Apex makes no representation, warranty, or guarantee as to the accuracy or completeness of the information provided on academy.apexetrade.com. The Company and its affiliates, including shareholders, board of directors, employees and vendor of Apex, shall not be liable for any consequences, including but not limited to direct, indirect, or consequential losses, loss of profits, and damages, resulting from reliance on the information provided.
By continuing to use this website, you acknowledge that you have read and understood this disclaimer. Apex Securities Berhad reserves the right to modify, add, remove, or amend any or all of the provisions herein or any contents on academy.apexetrade.com at any time without prior notice.
This disclaimer is specific to Apex Securities Berhad and the academy.apexetrade.com website and is subject to periodic updates or amendments.
Apex Equity Holdings Bhd Group of Companies (“APEX”) Website Terms and Conditions
Welcome to the official website of the Apex Equity Holdings Bhd group of companies, hereinafter referred to as "APEX". By accessing and utilizing this website, you expressly agree to be bound by the terms and conditions delineated herein. We urge you to carefully peruse and fully comprehend these stipulations, as they form an integral part of the framework governing your interaction with our services.
1. Modifications of Terms
APEX, in its sole discretion, reserves the unmitigated right to amend, alter, or replace these Terms at any juncture, without prior notice. It is incumbent upon you, as the user, to periodically review and acquaint yourself with any such modifications. Continued use of our services subsequent to any alterations shall be deemed as an unequivocal acceptance of the revised Terms.
2. Registered Users
To access certain features and restricted areas on the APEX website, users must complete the registration process. Upon successful registration, users shall be deemed "Registered Users" and will be entitled to additional services. Registered Users are strictly prohibited from disclosing their assigned user ID and password and must diligently safeguard their confidentiality. They bear full responsibility for all activities conducted under their account. APEX reserves the right to request verification of identity and/or age.
3. Age Requirement
Usage of this Website is strictly contingent upon attaining a minimum age of
18 years.
4. Copyright and Use Limitations
The content disseminated on Apex is legally protected by copyright and other pertinent intellectual property laws. Such content is intended exclusively for personal, non-commercial purposes. Any form of reproduction, distribution, sale, or unauthorized use thereof is categorically prohibited without prior written consent from APEX.
5. User Content
Users are exclusively liable for all content posted or shared on the Service. Posting content that has not been created by the user or lacks proper authorization is expressly prohibited. APEX reserves the discretionary right to decline, delete, or remove any User Content that contravenes these Terms or for any other reason it deems fit.
6. Content Disclaimer
Content featured on Apex may incorporate opinions and recommendations from various sources, including research emanating from APEX, which holds a license to dispense investment advice. Notwithstanding, APEX neither assures nor warrants the accuracy, completeness, or timeliness of such content, and explicitly refrains from providing any tax advice.
7. User Conduct
It is incumbent upon users to ensure that their use of the Service remains in strict compliance with our House Rules, and that it refrains from infringing upon any third-party rights or violating any extant laws.
8. Financial Disclaimer
APEX operates as a financial data and news portal, research analysis platform, technical analysis provider, and content aggregator. It is crucial to underscore that APEX does not furnish personalized investment advice, and underscores that all investment decisions should be made judiciously, predicated upon individual circumstances.
9. Warranties
The Website and its content are subject to change over time. APEX does not extend any guarantees or warranties pertaining to losses that may be incurred as a result of any failure or content featured on the website.
10. Indemnity
By accessing and utilizing the Service, you expressly agree to indemnify and hold APEX harmless from any and all loss, liability, claim, demand, or expenses that may arise from your utilization thereof.
11. Privacy
Safeguarding your privacy is of paramount concern to us. For a detailed exposition of our privacy policies, please refer to our Privacy Policy.
12. Governing Law
This site is administered by APEX from its offices in Malaysia. Therefore, the use of this site is explicitly subject to the laws of Malaysia.
13. Contact
For any questions or concerns regarding these Terms and Conditions, please do not hesitate to contact us at:
[Contact Information]
This privacy statement (“Statement”) sets out the manner of how Apex Equity Holding Bhd group of companies (“APEX” or “we”) use and protect information that you provide to APEX when you use this website and sign up for the services and products provided by APEX (“Services”). We are committed to safeguarding your privacy while providing you personalized and valuable services. In order to sign up on our website and/or engage us for the Services and/or continue to use our website and/or Services, you will be required to consent to the processing of your personal information (“Data”) by us for our provision of Services.
Our site contains links to third party sites, which are not subject to this Statement. We do not endorse and are not responsible for the privacy practices or contents on these sites. We recommend you to read the privacy policy of the sites that you visit.
We encourage you to periodically review this Statement as we may revise or modify this Statement from time to time. In the event of such revision or modification, you will be notified of the same via email/postal mail/short message service (SMS) or notice posted on our website and you will be required to agree to be bound by, accept and consent to such revision or modification. By continuing to use our website and/or Services aftersuch notification, you have given us implied consent to continue with the processing of the Data for our provision of Services.
1. Collection of Your Data:
1.1. In the course of providing the Services, we will collect Data from the following sources:
The Data that we collect and process is categorized into:
(a) Mandatory Information:
Mandatory Information are personal details and information, which may include:
1.2. In respect of the Mandatory Information, when registering on our website and/or subscribing to the Services you agree and consent to:
1.3. In the event if you choose not to provide the Mandatory Information to us, we may not be able to provide the Services to you.
(b) Optional Information
Optional Information are personal details and information which includes:
2. Sharing of Your Data:
2.1. Your Data will be used and processed in order to provide you with the Services, as well as for us to conduct analysis related to the Services. As such, we may share your Data with our affiliates or disclose your Data to the following third parties:
2.2. APEX will not disclose your Data to any unauthorized third party, in compliance with Rule 5.16(6) of the Rules of Bursa Malaysia Securities Berhad.
3. Confidentiality and Security of the Data:
3.1. We maintain physical, electronic and procedural safeguards to protect the Data from any unauthorized access or intrusion. We limit access to the Data only to our employees, contractors/service providers and agents who need such access for the provision of the Services or for other legitimate business purposes. We will at all times comply with all laws and regulations to which we are subject to regarding the collection, usage and disclosure of the Data.
4. Your Right to Access Your Data:
4.1. You may access to your Data, make request for corrections and/or deletions to be made to your Data or make enquiries and/or complaints with regards to the Data at any time by providing your request together with your reason in making such request in writing (“Request”) to ensure that your Data is accurate, complete and up-to-date and we will respond to you within 21 calendar days from our receipt of the Request. Your Request may be made to our Customer Service Representative, which can be contacted at:
Customer Service Representative Address:4.2. However, we reserve the right not to process the Request if, in our opinion, the processing of the Request will jeopardize the security and privacy of the personal information of others as well as if the Request is impractical or not made in good faith, or if we are not able to identify whether the Request came from you.
5. Your Right to Limit Use of Your Data:
5.1. You may withdraw your consent granted to the processing of the Data by giving a notice in writing to our Customer Service Representative as detailed in Section 8 of this Statement, and we shall comply with such written notice issued by you. If you withdraw your consent, we may not be able to continue to provide you with the Services you have applied / signed up for.
5.2. We will seek your consent as to whether you wish:
6. Keeping your Data:
6.1. We will retain the Data for 7 years from the date the Data ceases to be necessary for the provision of the Services. In the event if a further retention period is required, we will obtain further consent from you for the retention of the Data.
7. Cookie:
7.1. A cookie (“Cookie”) is a small file that is placed on your computer’s hard drive upon relevant permission from you is obtained. Certain websites generate Cookies which are collected by web-servers to enable the web-servers to recognize your future visits. Once you have given your permission, the Cookie will be added to your computer’s hard drive and it will help web-servers to analyze web traffic or let you know when you visit a particular site. Cookies allow web applications to respond to you as an individual. Web applications can tailor their operations to your needs, likes and dislikes by gathering and remembering your preferences.
7.2. We may use traffic log Cookies to identify the web pages in our website that are visited by our clients. This can help us to analyze data about web page traffic and to improve our website in order to tailor it to customers’ needs. We will only use this information for statistical and analysis purposes and upon fulfillment of this purpose, this information will be removed from our system.
7.3. Cookies help us to provide you with a better website, by allowing us to monitor which web pages may be useful/of interest to you. A Cookie does not give us access to your computer or any information about you, other than the data you choose to share with us. You may choose to accept or decline Cookies.
7.4. Most web browsers automatically accept Cookies, but you may modify your browsers settings to decline Cookies at your option. However by choosing this option, you may be prevented from taking full advantage of our website.
8. Feedback/ Inquiries:
8.1. We welcome all feedback/inquiries regarding this Statement. Should you have any enquiries or concerns relating to the use or storage of the Data, our Customer Service Representative (CSR) can be contacted at:
Customer Service Representative (CSR) Address: